
The objective of this article is to share with you our method of assessing environmental impacts, resulting from many months of work by both our Research & Innovation team and our development team.
Fruggr’s ambition is to assess the impacts of a company’s entire IT chain: from hardware to infrastructure, as well as operational aspects such as marketing campaigns or digital applications. These impacts can be of different natures: social, societal or environmental.
With this ambition in mind, since 2020, we have been developing different modules to assess these impacts and propose recommendations, enabling users not only to observe but also to act.
Our modules and our work are designed to support our users in a continuous improvement approach.
Our motto : «No improvement without measure»
The starting point for improving the impact of digital services is therefore the evaluation of impacts.
LCA as a methodological tool
“Life-cycle analysis is the most comprehensive tool for the global and multi-criteria assessment of environmental impacts” (source ADEME)
Its implementation is standardized and adaptable in all areas of activity. The ‘digital LCA’ type emerged a few years ago to address the specificities of the sector .
All fruggr modules are designed with the main principles of the digital LCA methodological guides in mind:
- Cover all phases of the life cycle: fruggr covers both intrinsic impacts (related to the manufacturing, transport and end-of-life phases, equivalent to scope 3 of the carbon footprint) and operational impacts (related to use, equivalent to scope 2 of the carbon footprint).
- Have a component approach based on the principle of cutting into families of equipment (terminals, networks, datacenter) in its analyses: fruggr separately evaluates the impact of user terminals, the impact of networks and the impact of hosting.
- Provide a multi-criteria approach: today, the focus is mainly on carbon impact assessment but fruggr is designed to assess all environmental indicators impacting the digital field (Methodological framework for environmental assessment of digital services), with for example the depletion of natural resources or emissions of fine particles.
The Digital LCA approach to assess the environmental impacts of web platforms
To assess the environmental impacts of web platforms, fruggr relies on a Digital LCA methodology. Fruggr offers two analysis modes :
- The overall analysis of the service – said page by page – : we analyze all pages of the digital service in read-only mode
- User journey analysis on the digital service by executing a series of actions (navigation, click, field entry in a form, etc.).
Regardless of these 2 modes, fruggr runs take 3 steps:

Phase 1. Automated collection
In all carbon footprint or other LCA projects, the collection of flows is one of the most laborious but essential phases. Indeed, the collection of manual information is often incomplete and makes analyses difficult and time consuming.
Our bias is to automate this entire collection phase to limit the effort for our users and therefore encourage the continuous analysis of their services.
Our two main sources of information are:
- A robot for analysis
- Audience data from analytics platform
💡 fruggr also collects source code information via automated connectors to help developers be more sober in their developments.
The analysis robot
It is a robot that scans either the entire digital service in read-only mode (global analysis of the service), or following a predefined path with user actions (analysis of a functional unit of the service).
The robot relies on a browser (in this case chromium) to operate so that the actions of loading, creating and displaying pages are evaluated in real conditions.
Always with the aim of being the most representative of real usage, our robot runs in different configurations and executes the service in various situations :
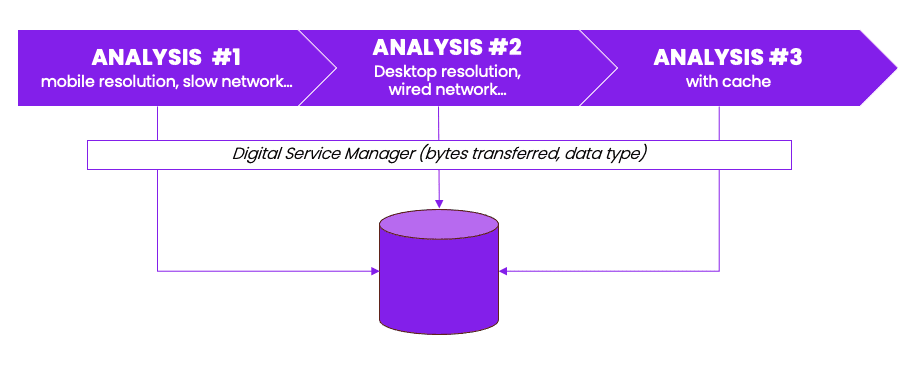
To browse all pages of the site, fruggr relies in particular on the sitemap of the site or retrieves all the links available during the analysis of the page. fruggr also has the ability to analyze pages protected by login/password systems or even services hosted on internal networks.
Analytics
Calling external APIs to analytics providers retrieves data related to the actual use made on a service. As a result, fruggr retrieves information such as number of views, audience location, average visit duration, etc.
If the service does not have analytics, we offer a solution to manually declare this usage data.
Phase 2. Environmental Impact Assessment
Our evaluation engine is based on the data collected during the first phase. The calculations are broken down by third parties (terminal, network and data centre) and on two types of footprint:
- The operational footprint related to energy consumption
- The intrinsic footprint related to the manufacture and end of life of the equipment used
Our evaluation engine is based on the data collected during the first phase. The operational impact is obtained by applying to the energy consumed, our factors of impact of electricity by geographical distribution (available in Open Data: https://github.com/digital4better/data).
The intrinsic impact is calculated based on the footprint from the LCA of the manufacturers of equipment, database as the footprint base and applying a ratio between the actual use of the service and the estimated life of the equipment.

External sources used for our evaluations include:
- The Green Web Foundation
- Ember where we recover the energy mix of the countries that allows us to build our own repository of factors
- Cloud carbon Coefficients
- ADEME footprint database
Emission factors and other constants are transparently shared on the fruggr platform. They are also configurable to stick closer to the contexts of our customers.
The evaluation of the environmental impacts of services is based on impact formulas, common for the score and footprints.
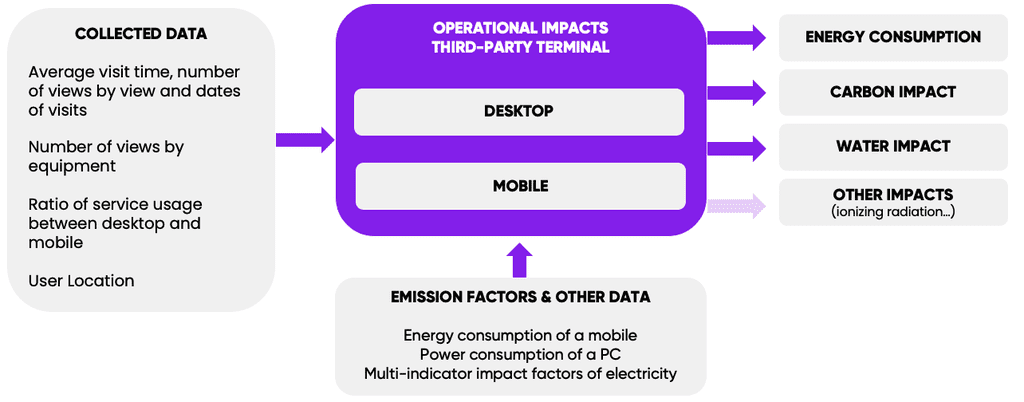
Environmental Impact Assessment of the Third-Party Terminal
The intrinsic impacts of the ‘Terminal’ third party are calculated as follows :

Operational impacts are calculated in this way :
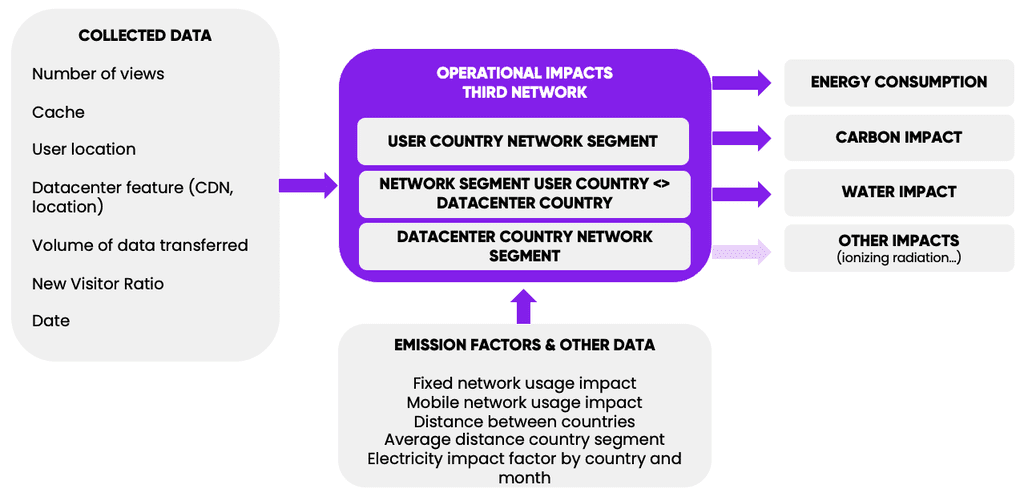
Environmental Impact Assessment of the Third Party Network
The intrinsic impacts of the Third Party Network are calculated as follows :
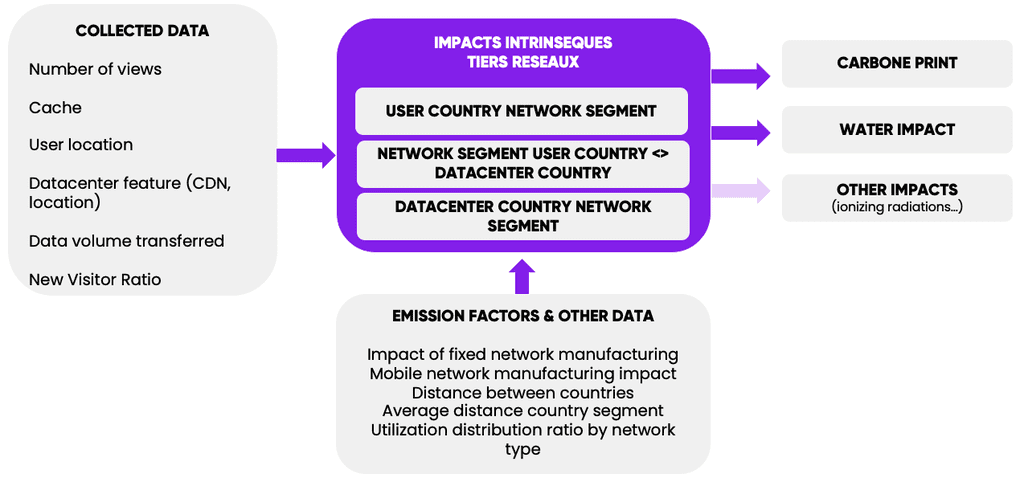
The impacts on this third party are globally complex; few data are present in the literature. To date, we rely on data from ADEME/ ARCEP. Operational impacts are assessed using this approach :
The location of users allows us to estimate the distance traveled by the data between the location of the user and the datacenter.
The impacts on this third party are globally complex, few data are present in the literature : CT report: European Commission, ICT Impact study, Final report, prepared by VHK and Viegand Maagøe for the European Commission, July 2020, p.73.
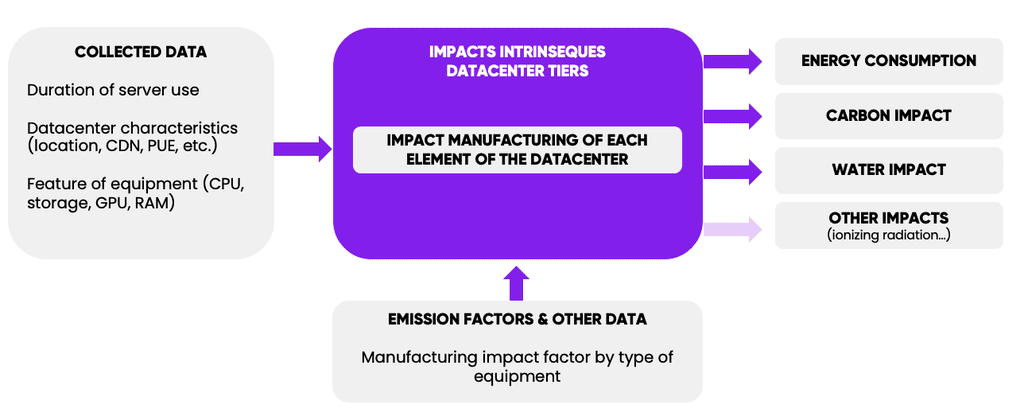
Environmental impact assessment of the third-party Datacenter
The intrinsic impacts of the datacenter tiers are calculated as follows :
Operational impacts are assessed using this approach :
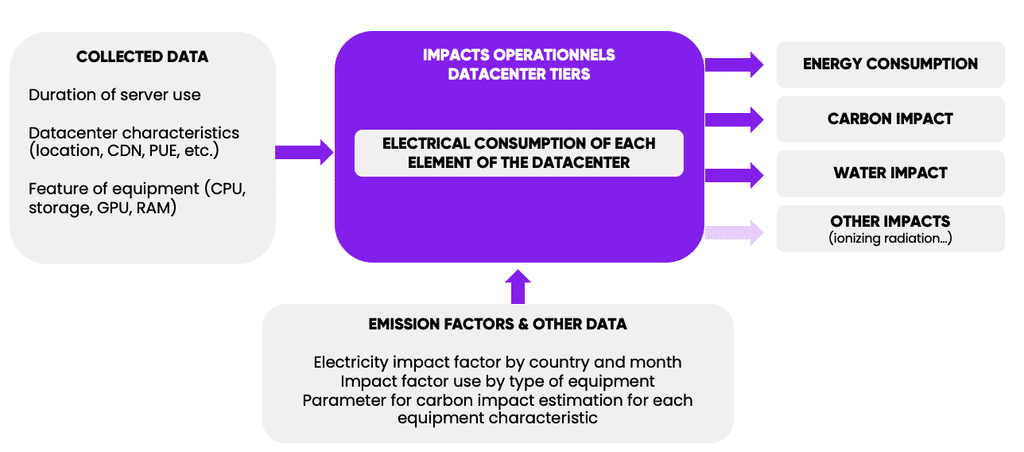
The principle of our assessment is to determine the energy consumption of the different elements of the service infrastructure and then to weigh it against a duration of use of the server and finally to extrapolate the carbon footprints, water depending on the energy mix of the country where the datacenter is located.
The environmental score fruggr
The notion of footprint is the most tangible and precise element to assess the environmental impact.
Nevertheless, these footprints do not necessarily reflect the good level of eco-design of a digital service. Indeed, an eco-designed website can have a very high environmental footprint especially if its number of users is very large.
Based on this observation, we created a fruggr score ranging from 0 to 100 to assess the level of eco-design of the service.
This score and its scale were calibrated based on the analysis of one million home pages from httparchive.
To evaluate this score, we set constants identical to all services to evaluate the energy consumption of it. From this consumption, we define the fruggr score.
Phase 3. Restitution and Engagement
The final phase is to display the calculated data to users to help them understand the footprints of their digital services.
Here is an example of components offered to users in fruggr :

Beyond these indicators, fruggr also offers (and this for all impacts including social) a recommendation engine offering concrete actions to reduce the impacts of your digital services.
These recommendations are based in particular on the RGESN, GR491 or WSG repositories.
Our vision
Since our creation, our desire has been to continuously improve our environmental impact assessment engine. The objective is for our analyses to be as close as possible to reality. The latest evolutions of our engine go in this direction.
Our ambition for 2024 is to integrate more environmental criteria and to incorporate a PEF score (Product Environmental Footprint; the most scientifically and comprehensive environmental assessment method launched by the European Commission) into Fruggr.”
This article, we hope, brings more transparency on our model, our bias. As such, we are in the process of critically reviewing our model with third-party experts to ensure the relevance of our model.
Beyond the intervention of our experts on different working groups, we wish to confront ourselves more to the ecosystem and we propose you to join our scientific committee
And the impact of fruggr in all this?
Beware of the rebound effect, we are careful that fruggr analyses do not generate a larger footprint than those saved through the application of recommendations.
As a result, we have applied this digital LCA approach to our platform. We estimate that the analysis of a digital service averages 12 gCO2e
In a logic of sobriety, we propose functional technico levers to limit the impacts generated by the use of our platform: scope of the limited audit, analysis prioritized on pages and functionalities with the most impact…